Manufacturers and plant engineers
Teams that need to see machine status, downtime and alarms without walking the floor or waiting for an end-of-shift report.
Turn signals from machines and sensors into live status, alerts and reports your engineers use. We build the whole chain: data collection at the equipment, processing in the cloud, and web and mobile apps on top.
Tell us what you need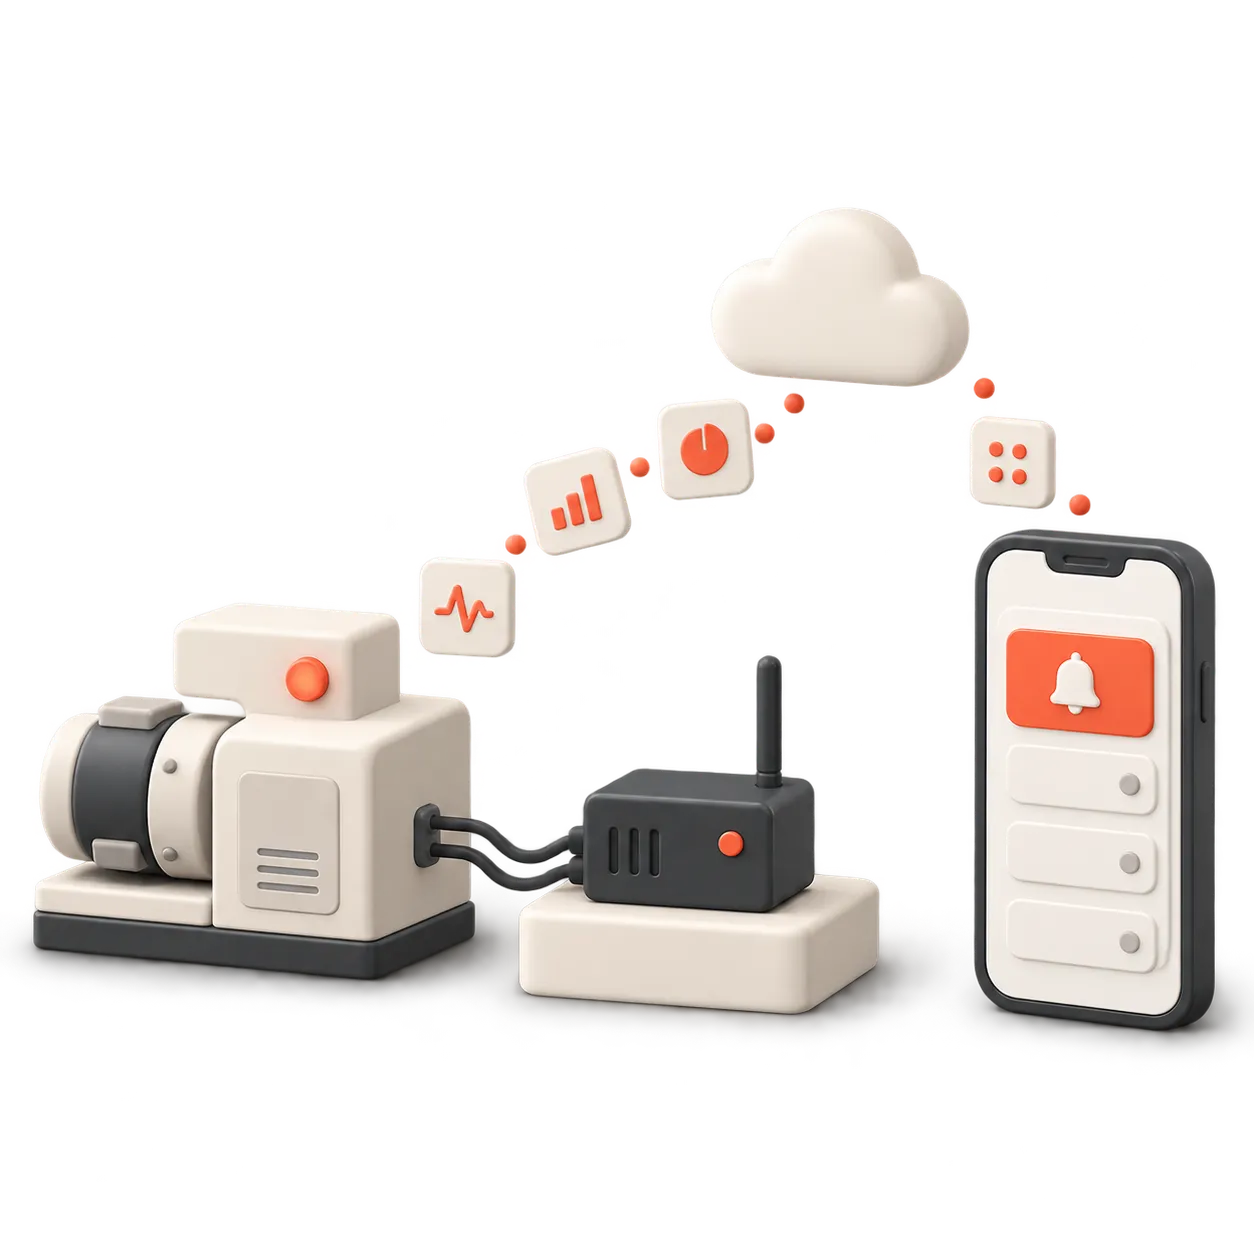
Industrial IoT projects stall at the seams: the sensor works, the dashboard looks good, but the data between them is late, incomplete or in the wrong format. As an IoT development company we build and own the whole chain, from the adapter next to the machine to the alert on an engineer’s phone, so there is no gap between hardware, backend and apps.
Machines speak different dialects. Even within one standard such as MTConnect, adapters from different vendors and generations return different XML structures. We collect the data locally, parse each format into one common model and add the context that makes it useful: which machine, which line, which shift.
For a Fortune 200 CNC manufacturer, C++ adapters connect machine-side data and a desktop collector requests current data from each machine agent, parses the XML response and sends normalized samples to the backend.
Raw signals are not status. Rules turn them into states people understand, such as normal, warning and failure, and compare alarms over time to notify people only when something new happens. Connectivity checks catch machines that stop reporting, so silence is not mistaken for a machine that is running fine.
In the CNC monitoring system, Go services process incoming samples, track machine availability and push live updates over WebSockets, while an API handles companies, users, machines, watchlists and alarm subscriptions.
Engineers get live views of the machines they are responsible for, alarm notifications on Android and iOS, and history for reporting. Administrators manage users, machines and alarm settings in a web application. Access follows responsibility, so each person sees their own machines and functions.
Collection can stay in the plant while processing, dashboards and mobile access run in the cloud. The CNC monitoring platform was built on AWS; see cloud and AWS for how we host business applications. Where data must stay on site, the same architecture runs on your servers.
For the production side, such as work orders, traceability and order portals, see custom manufacturing software.
Teams that need to see machine status, downtime and alarms without walking the floor or waiting for an end-of-shift report.
Companies that want to give their customers or service teams remote visibility into the machines and devices they sell.
Adapters, gateways and local collectors that read machine and sensor data through standard protocols or vendor interfaces.
Parsing different data formats into one model, status and alarm rules, connectivity checks and history for reporting.
Live views for engineers and supervisors, watchlists, alarm notifications on phones and access limited to each user's machines.
Authenticated devices and users, encrypted connections, monitoring of the pipeline itself and documentation for your team.
Machine monitoring on AWS: C++ adapters and a desktop collector read MTConnect data, Go services process samples, track availability and push live updates, and web, Android and iOS apps show status and alarms to the engineers responsible for each machine.
Pick representative machines, confirm what data each one can provide and agree which states and alarms matter to the people on the floor.
Senior engineers use AI-assisted delivery to target the first working release in 14 days: data flowing from real machines to a live view. More machines, sites and reports follow in agreed milestones.
Pricing: Fixed price per milestone, no hourly billing. About a third of a traditional team's quote for the same scope. Hardware, connectivity and cloud usage are estimated separately.
Common ones include MTConnect and OPC UA for machine tools and industrial equipment, MQTT for sensors and gateways, and vendor APIs or databases where a machine offers them. We confirm what each device can provide before designing around it.
No. Collection and processing can run on servers in the plant, in the cloud or both. Many projects keep collection local and send processed data to the cloud for dashboards and mobile access.
The system notices when data stops arriving, marks the machine as unavailable and can alert the responsible people. Local collectors can buffer data and send it when the connection returns.
Usually. Machines with network-capable controllers can be read directly; older ones may need an adapter, a gateway or added sensors. A short assessment of your machine types tells you what is possible and what it costs.
You do. The data stays in your environment or your cloud account, and you receive the code and documentation for everything we build.
Choose the way you prefer to get in touch.
Pick a time for a 30-minute conversation. No need to fill out that form if you don’t want to :)
Book a 30-min callWrite to us directly at hello@devvela.com.
Your inquiry has been received. We will reply to the email address you provided.